



Profitability: did the trip make money?
Revenue, cost and margin per departure and per product, with planned against actual cost and a variance.
Click Finance, then Profitability. This is the report that answers whether the work was worth doing.
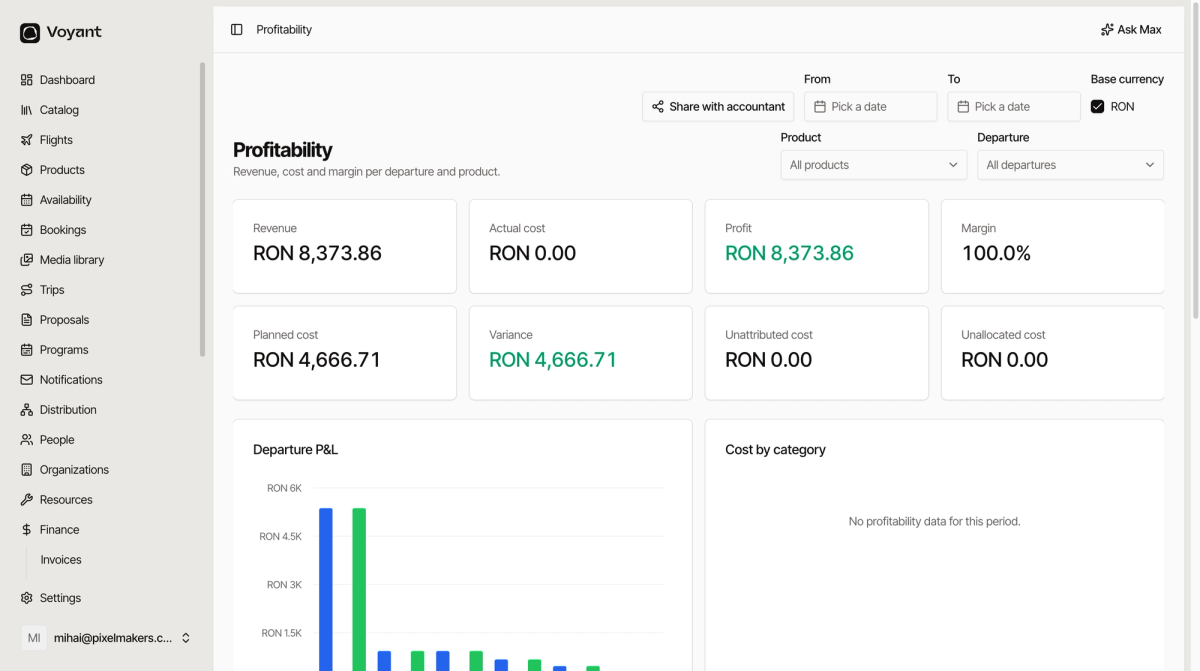
The eight figures
- Revenue, what customers paid.
- Actual cost, what you were really charged, from supplier invoices.
- Profit and Margin, the result.
- Planned cost, what you expected to pay, from the cost prices on your products.
- Variance, the gap between planned and actual.
- Unattributed cost, cost recorded but not tied to a departure.
- Unallocated cost, cost not yet split across the trips it covers.
Read actual cost first
If Actual cost is zero and Margin is 100 percent, you are not looking at a profitable month. You are looking at a month whose supplier bills have not been entered.
The Planned cost figure beside it shows what you expected to spend, and that gap is the clue.
Unattributed and unallocated
These two should stay near zero. Anything sitting in them is real money that has not been connected to a trip, which means every per-departure figure is understating its cost.
Filtering
Set a From and To date, and narrow by Product or Departure. Base currency converts everything into one currency so mixed-currency months add up.
Per departure
The table at the bottom breaks it down by departure, with revenue, actual cost, planned cost, profit, margin and variance on each. Export CSV takes it into a spreadsheet.
Share with accountant
The button at the top shares the report without giving somebody a full login. Useful at month end.
Did this answer your question?
Thanks for your feedback.