



Custom widgets
When no preset fits, write a short query against one of the reporting datasets and preview it before you add it.
The presets cover the usual questions. When yours is not one of them, click Custom widget in edit mode and write it yourself.
This is the one genuinely technical corner of Voyant, but the query is short and there is a Preview button, so trial and error is cheap.
The two datasets
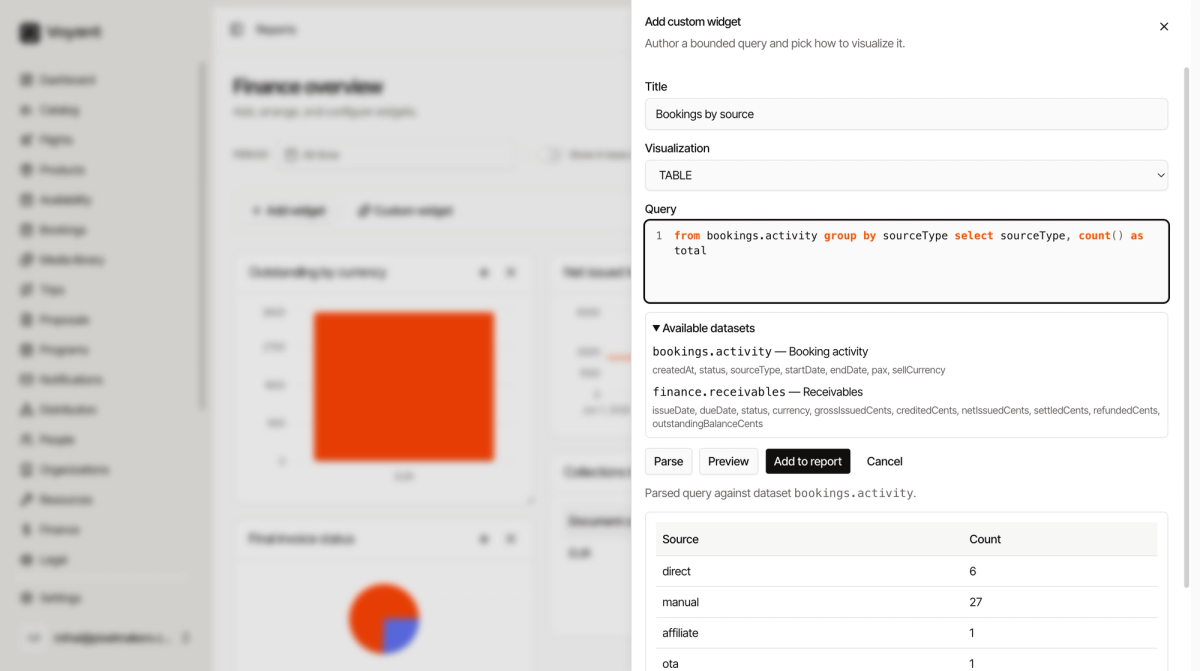
Expand Available datasets to see what you can query and which fields each one has.
bookings.activity
One row per booking. Fields: createdAt, status, sourceType, startDate, endDate, pax, sellCurrency.
finance.receivables
One row per invoice. Fields: issueDate, dueDate, status, currency, grossIssuedCents, creditedCents, netIssuedCents, settledCents, refundedCents, outstandingBalanceCents.
The query
A query reads almost like a sentence. Take the data from somewhere, group it, and pick what to show.
from bookings.activity group by status select status, count() as total
That is "count the bookings in each status". Change one word to ask a different question.
from bookings.activity group by sourceType select sourceType, count() as total
That one counts bookings by where they came from: direct, manual, affiliate, OTA, reseller, API partner.
Narrowing it
Add where to filter before grouping.
from finance.receivables where status = 'issued' group by currency select currency, sum(outstandingBalanceCents) as owed
That totals what is still owed, per currency, counting only invoices that have been issued.
count() counts rows. sum() adds a field up.
Steps
- Give the widget a Title.
- Choose a Visualization: KPI, TABLE, LINE, BAR or PIE.
- Type the Query.
- Click Parse. It confirms which dataset you hit, or tells you what it could not read.
- Click Preview to see real results.
- Click Add to report.
Match the shape to the answer
A query returning one number wants KPI. One returning a handful of categories wants PIE or BAR. One returning dates wants LINE. One returning many columns wants TABLE.
Did this answer your question?
Thanks for your feedback.