


Add widgets to a report
Pick from ready-made widgets, preview each one before committing, then drag them into the layout you want.
Open a report and click Edit. The header changes to "Add, arrange, and configure widgets" and two buttons appear.
Click Add widget.
The presets
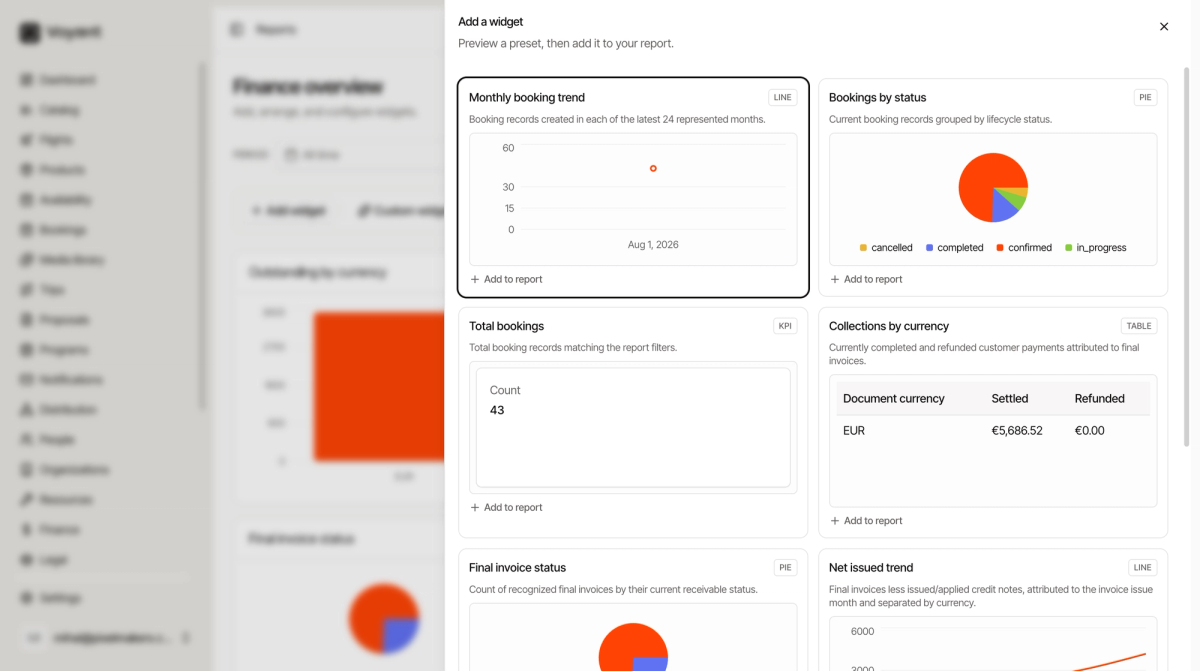
Each card shows what the widget does, what shape it is, and what it looks like filled with your data. No guessing from a name.
- Monthly booking trend, a line of bookings created per month.
- Bookings by status, a pie of cancelled, completed, confirmed and in progress.
- Total bookings, a single number.
- Collections by currency, a table of settled and refunded payments.
- Final invoice status, a pie of issued against paid.
- Net issued trend, invoices less credit notes, month by month.
- Outstanding by currency, a bar of what is still unpaid.
Click Add to report on the ones you want. Add several in one go, the panel stays open.
The five shapes
- KPI, one number. Best for the figure you want to see immediately.
- TABLE, rows and columns. Best when the detail matters.
- LINE, change over time.
- BAR, comparing sizes.
- PIE, parts of a whole.
Arranging
Drag a widget by its title to move it. Drag the corner to resize it.
If you would rather not drag, click a widget and use the arrow keys to move it, or hold Shift with the arrow keys to resize.
Renaming and removing
The gear icon on a widget opens Configure widget, where you can rename it or click Remove widget. The cross removes it directly.
Renaming is worth doing. "Net issued trend" means something to whoever built the report and nothing to whoever reads it. "Invoiced per month" is clearer.
Put the important thing top left
People read a dashboard the way they read a page. The number you actually care about belongs in the top left corner, not buried at the bottom.
Did this answer your question?
Thanks for your feedback.