



Reports: build your own dashboard
Start from a template or an empty canvas, then add the numbers you actually look at each week.
Most screens in Voyant answer one question about one thing. Reports is where you put several answers on one page and keep them there.
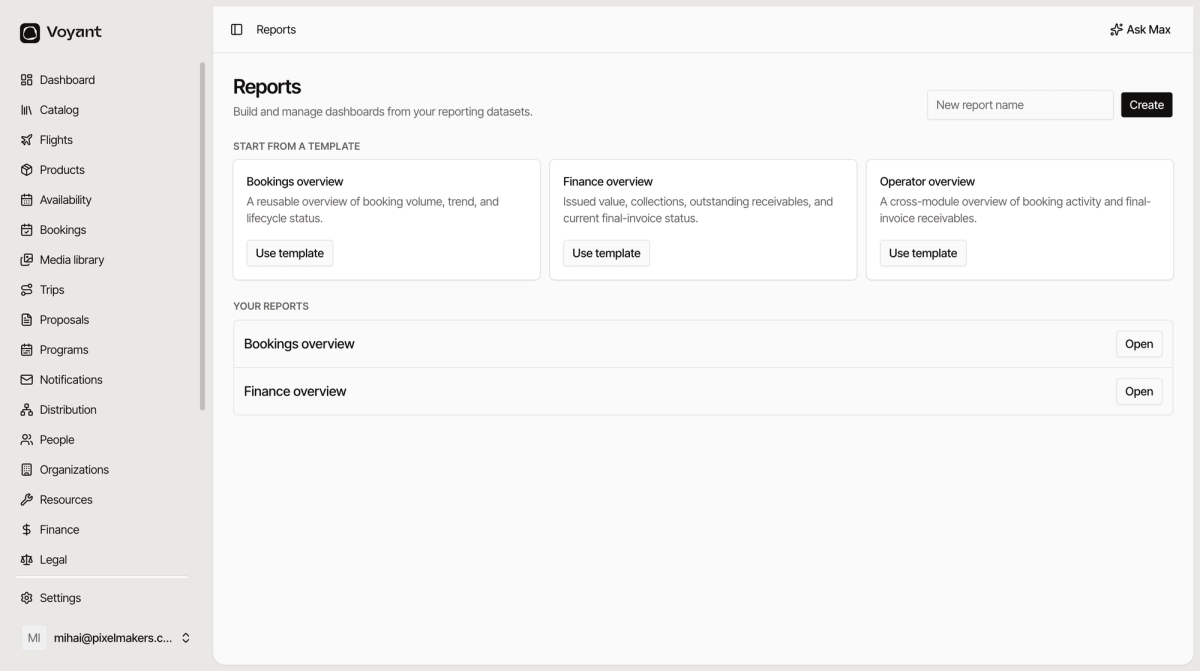
Click Reports in the left menu.
Start from a template
Three templates come ready to use.
- Bookings overview, booking volume, trend and lifecycle status.
- Finance overview, issued value, collections, outstanding receivables and invoice status.
- Operator overview, a bit of both.
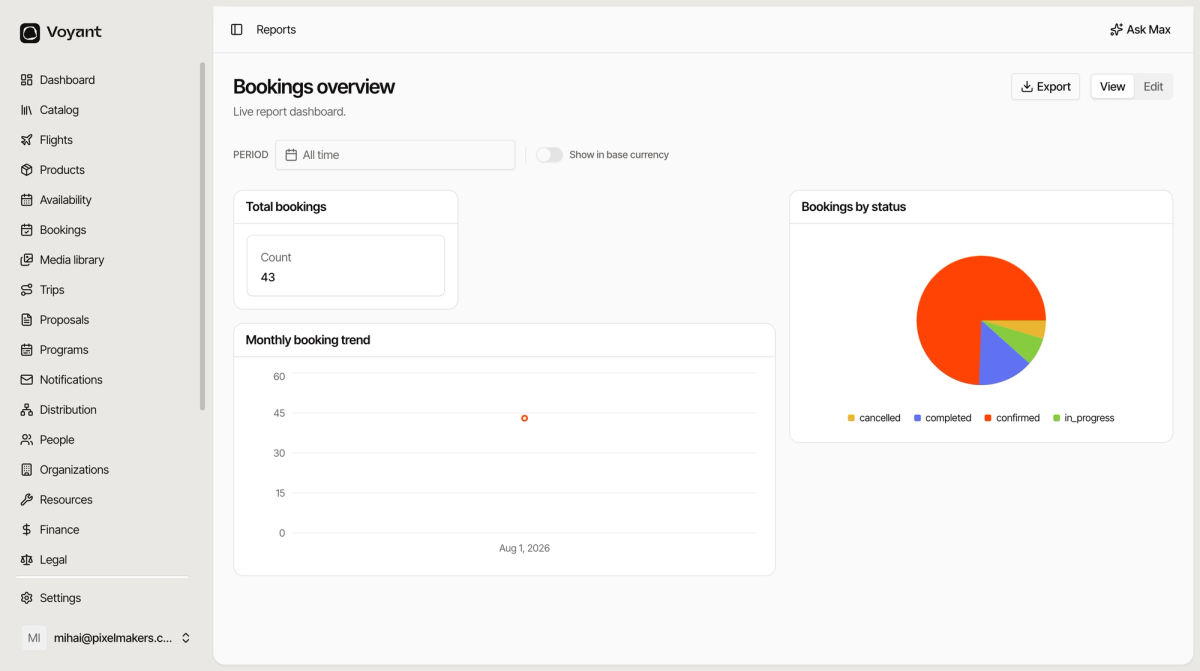
Click Use template and you get a working dashboard straight away. It is a copy, so changing it does not affect the template or anyone else.
Start from scratch
Type a name in the box at the top and click Create. You get an empty report to fill with the widgets you want. See Add widgets to a report.
Your reports
Everything you have made appears under YOUR REPORTS. Click Open to view one.
Reports are live, not snapshots
A report re-runs its numbers every time you open it. Bookmark one and it is always current, which is what makes it worth building a Monday-morning dashboard.
When to use Reports and when not to
Reports is for the numbers you check repeatedly. For a one-off question, the module screens are usually faster: Bookings for a specific booking, Finance for what a customer owes.
For trip-level margin, use the purpose-built Profitability report instead. It knows about planned cost, actual cost and variance, which the generic widgets do not.
Did this answer your question?
Thanks for your feedback.